Log and reports
See exactly what BotBlocker did with each visitor, and why.
The settings pages tell you what BotBlocker is set to do. They cannot tell you what it actually did. When a customer writes "your site blocked me", or your hosting panel shows a strange traffic spike, you need the record of the requests themselves. That record is on the Log and Statistics page, under BotBlocker → Reports.
Totals and charts give a quick overview, and the tables hold every recorded request. Each row ends with BotBlocker's decision in plain words. From there, one click on a row lets you allow or block that visitor, so you go from "someone was blocked" to "this rule blocked them, and here is how to fix it" in a few minutes.
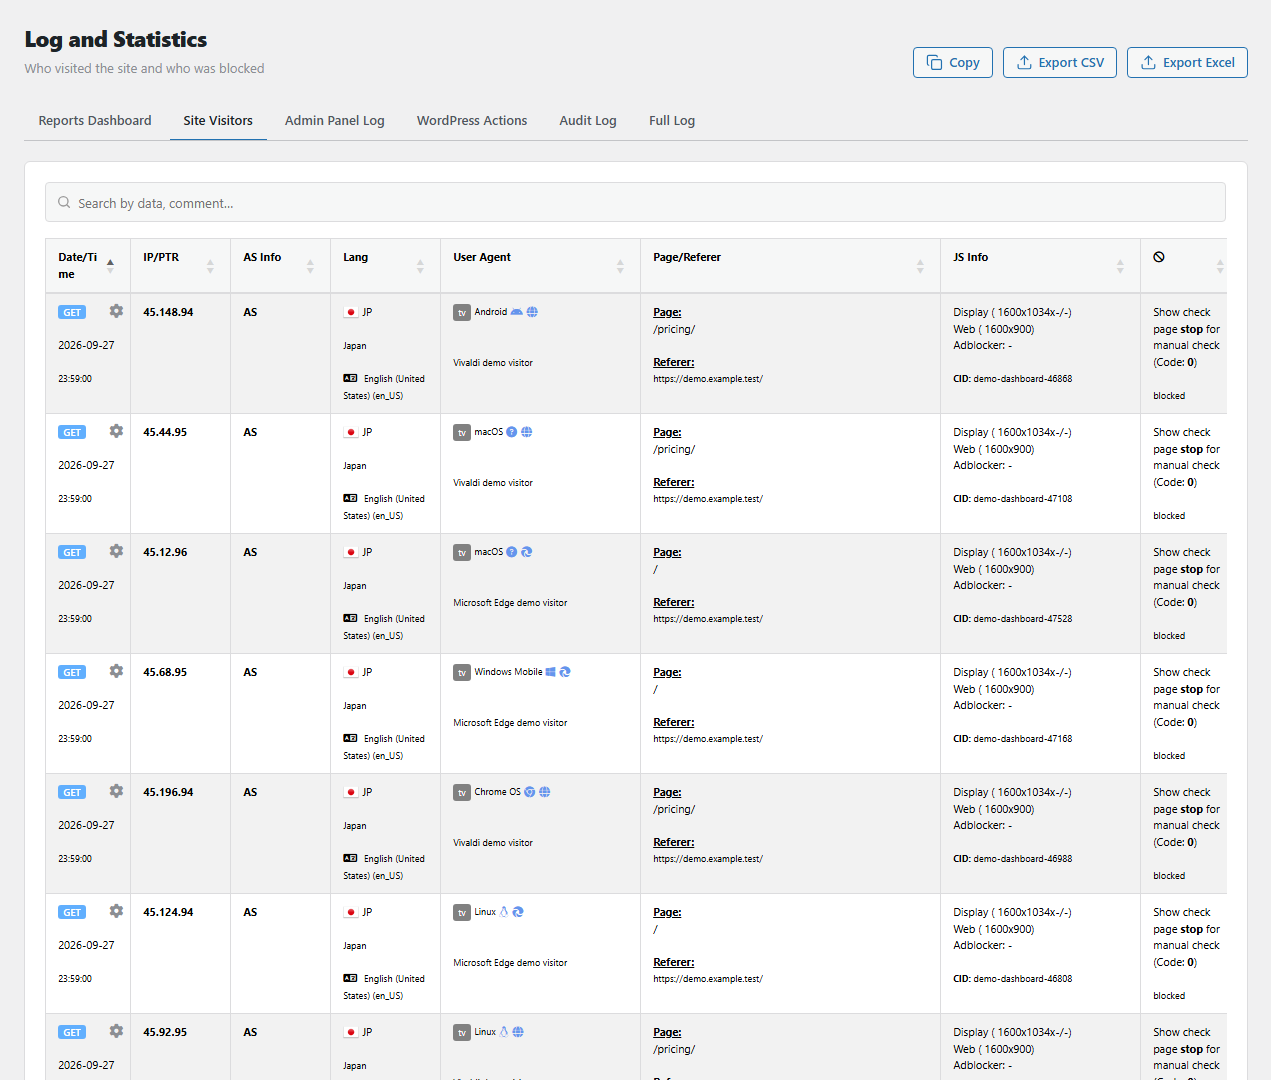
The Site Visitors tab. Open it from BotBlocker → Reports.
The page has six tabs
| Tab | What it shows |
|---|---|
| Reports Dashboard | Totals, charts, and top lists for the report period |
| Site Visitors | Requests from ordinary visitors to the public site |
| Admin Panel Log | Requests to admin and login paths, and from signed-in administrators |
| WordPress Actions | WordPress system requests, such as REST API calls, comment submissions, and wp-cron.php |
| Audit Log | Actions taken by your WordPress users, with its own filters |
| Full Log | Every recorded request in one table |
A tab shows only what was recorded. Which request types are recorded is up to you, see Traffic and audit logs. For example, Admin Panel Log stays empty while Log Actions in WordPress Admin Panel is off.
The dashboard gives the big picture
The Reports Dashboard tab shows the total requests and total blocked requests, the number of malicious IP addresses BotBlocker knows, how visitors were verified, site traffic over time, and geographic data with top lists of countries, browsers, devices, and networks. It covers the Report Period: you set in Notifications and reports, and it counts in the Statistics Display Mode you chose there.
Use the dashboard to spot a trend, for example more blocked traffic from one country this week. Then switch to a table tab to see the individual requests.
Reading one row
Each traffic row answers two questions: who was the visitor, and what happened to them.
- Time: when the request arrived, in the time offset from Notifications and reports. A gear button next to it opens the rule dialog.
- IP, PTR, and AS Info: the address, its host name from a reverse DNS lookup, and the network (ASN) it belongs to.
- Lang, country, device, system, browser, and User Agent: what the visitor's browser said about itself.
- Page and Referer: what was requested, and from which page the visitor came.
- JS Info: what the browser reported during the JavaScript check, such as screen and window size and whether an ad blocker was found.
- JA3/4: the TLS fingerprint, when it is available.
- The last column: BotBlocker's decision, as a short code and a plain sentence.
Read the decision sentence first. It names the reason, for example "Legal bot detected", "Fake bot detected", "Allow access to path", a rate limit, or a rule. The sentence tells you which feature decided, and so which settings page to open next.
Searching finds matches in the whole log
The search box on each table searches the whole stored log, not only the rows on screen. It matches the IP address, host name, network (you can type AS and the number), country, language, user agent, page, referrer, date and time, and the text of the decision. So you can start with whatever the visitor tells you: their IP address, the page they tried, or the time it happened.
Investigating one visitor, step by step
- Open BotBlocker → Reports and pick the tab where the problem happened: Site Visitors for a public page, Admin Panel Log for login and admin, WordPress Actions for comments or REST calls. If you are not sure, use Full Log.
- Search with what you know, for example the visitor's IP address or the page.
- Read the decision sentence and the code beside it.
- If you find nothing, the entry may never have been recorded (its category is off) or may already be deleted (it is older than the Log Retention Period:).
- If the visitor should be allowed, press the gear button on the row. The rule dialog opens with the visit's details already filled in. Choose which property to match (for example the IP address or the network), the action, the priority, and when the rule expires. See IP lists and Rules.
- If the visitor should stay out, add a block rule the same way, or change the setting that the decision sentence points to.
- To keep the evidence after the retention cleanup, use Copy, Export CSV, or Export Excel in the page header. They export the table on the current tab.
The audit log shows who changed what
The Audit Log tab lists what your WordPress users did, not what visitors did. It has three filters:
- Category: sign-in, content, users, media, comments, categories and tags, plugins, themes, WordPress core, settings, or BotBlocker itself.
- Severity: All severities, Info and above, Medium and above, or Critical only.
- Context: where the action came from, such as the admin area, AJAX, the REST API, XML-RPC, the front end, cron, or WP-CLI.
A search box works across the entries. The Actions column opens the full record: date, event, message, severity, the Actor and their role, the affected object, IP address, context, path, user agent, and extra data. For example, filter by Settings and Critical only to see who changed an important option this week. What is recorded, and for which roles, is set in Traffic and audit logs.
Handle exports with care
An exported file contains IP addresses, host names, user agents, and locations together. That is personal data in many countries. Store it like any other customer record, and delete it when you no longer need it. See Privacy and data.
An "allowed" decision is not proof that the visitor was a person. Some bots pass checks. Treat each row as evidence about a request, not about the human behind it.
When something goes wrong
- A visit you expected is missing. Check the tab, then the retention period, then the logging category for that request type in Traffic and audit logs.
- The export contains other rows than you expected. Exports follow the current tab and, for the audit log, the active filters and search. Set the filters first, then export.
- The table does not load or switch tabs. A tab loads its table when you open it. Wait until the current load finishes, then try again.
- Times do not match your day. Set GMT Offset for Reports: and Adjust for Daylight Saving Time, see Notifications and reports.
- The page is slow. Long retention and many active logging categories make the tables large. Reduce them in Traffic and audit logs.