Dashboard
One screen that tells you if your site is safe, and what happened today.
A security plugin works in the background, so it is hard to tell whether it is doing its job: whether protection is on, whether bots arrived today, or whether a setting lowered your score. You should not have to open five pages to find out.
The Dashboard answers all of that at a glance. It shows your protection status, today's numbers, a traffic chart, and your plan. From here, one click takes you to every other part of BotBlocker.
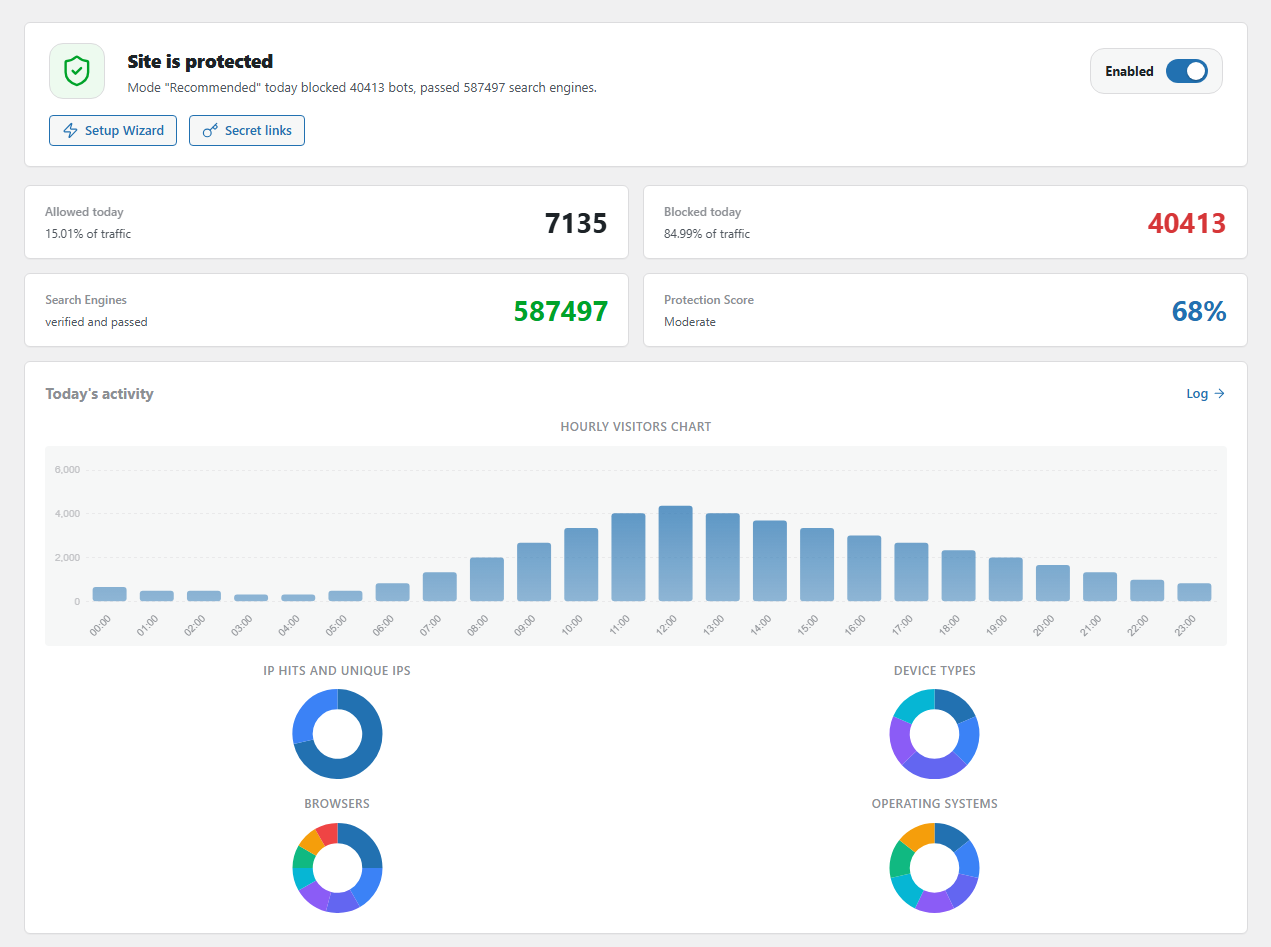
The top of the Dashboard: protection status, the on/off switch, today's numbers, and today's traffic. Open it from BotBlocker → Dashboard.
The banner tells you if you are protected
The large banner at the top gives the short answer. When protection is on, it shows Site is protected and a green shield. Below it, a line tells you how many bots BotBlocker blocked today, and how many search engine crawlers it let through. When protection is paused, the banner shows Protection paused with an amber shield.
The banner has three controls:
- The Enabled / Disabled switch turns all protection on or off. See Pause protection below.
- Setup Wizard opens the Setup Wizard, so you can apply a different protection level.
- Secret links opens your emergency links. With them, you can get back into your site if a setting ever locks you out. You can copy them, send them to your admin email, or make new ones. See Emergency recovery secrets.
Four numbers for today
Below the banner, four cards show today's results:
- Allowed today: requests that BotBlocker let through, and their share of all traffic.
- Blocked today: requests that BotBlocker stopped, and their share of all traffic.
- Search Engines: crawlers that BotBlocker checked and confirmed as real, for example Googlebot. See Trusted bots and AI crawlers.
- Protection Score: a number from 0 to 100% that shows how strong your current settings are.
The first two cards switch every few seconds between today and the totals since you installed BotBlocker (Total allowed and Total blocked).
What the protection score means
The score comes from your settings, not from your traffic. BotBlocker checks which important protections are on and adds points for each one:
- Up to 75 points come from the core checks that every site has: the CAPTCHA, blocking empty or simple bot user agents, missing browser language, missing JavaScript, fake referrers, proxies, old HTTP/1.0 clients, reCAPTCHA with keys, and the two block times.
- 12.5 points come from Cloud Validation.
- 12.5 points come from the other cloud and network checks, such as VPN and Tor blocking.
So a free site can reach about 75%. The cloud points need a PRO license. The label under the number helps you read it: Secure from 85%, Strong from 70%, Moderate from 50%, Weak from 25%, and Critical below that. When protection is paused, the score is 0.
A high score is a good sign, but it is not a goal on its own. A stricter setting that blocks your real customers is worse than a few missing points.
A checklist of the main protections
The Protection status panel lists seven important protections: cloud threat checking, empty User-Agent blocking, PTR/DNS anomalies, brute-force protection, CAPTCHA, simple bot user-agent blocking, and VPN and Tor blocking.
- A tick means that the protection is on.
- A cross means that it is off. It is not an error. Some sites turn a protection off on purpose.
Click Enable remaining to open the Settings page and turn on more protections. Click All checks to see the full list of checks.
Quick switches in the Status card
The Status card on the right shows the parts that make BotBlocker fast and early: Early Init, MU-plugin, Redis, Memcached, PTR cache, and UI Cache. Each switch works at once. A gear opens the full settings, and ? explains the item. These switches also show on other BotBlocker pages. Each one is the same setting as on its own page.
Today's traffic, hour by hour
The Hourly visitors chart in the Today's activity card shows your visitors hour by hour. A sudden peak is easy to see. It can be a bot wave, or a newsletter that you sent. Below it, round charts show IP hits and unique IPs, and which devices, browsers, and operating systems your visitors use.
The Dashboard shows totals, not single visits. To see each visit and the reason for each decision, click Log. See Log and reports.
Shortcuts to every part of BotBlocker
The Quick access tiles take you to the main pages: Settings, Advanced Protection, Rules & IPs, Log, Addons, Tools, Integrations, 2FA, System Status, BotBlocker PRO, Support, and Cron Jobs. Each tile has a short line that tells you what is there.
The header switches the interface language
The flag in the header opens a list of the languages that ship with BotBlocker. Pick one and the BotBlocker screens use it at once, without a page reload.
The choice belongs to your browser, not to WordPress. It changes the BotBlocker admin area only. Your WordPress dashboard, your theme and the public site keep the WordPress language. Another administrator on the same site can choose a different language, and the setting survives a sign-out because the browser keeps it.
This is separate from the language of the visitor check page. The check page follows the site language and the visitor's browser for the public modes, as Challenge modes explains.
Widgets on the WordPress dashboard
BotBlocker adds widgets to the WordPress Dashboard → Home screen. You can drag them like any other widget:
- BotBlocker Stats shows the same health gauge and counters as the Health Status page, in a compact form. A crown icon opens the PRO page, and a gear opens BotBlocker settings.
- BotBlocker Quick Rule creates an allow or block rule without leaving the WordPress dashboard. Set the priority, the address or subnet, the action, an expiry and a comment, then click Add Rule. The rule appears in your IP lists at once.
- BotBlocker News shows the latest BotBlocker news and the size of the cloud database. It is off by default in this build.
The Quick Rule widget also imports address lists from a TXT file, one address or CIDR range per line. White lists allow the addresses, black lists block them. The import adds new addresses and skips the ones that already exist. Invalid lines are skipped without stopping the import. On a large list, this is faster than pasting rows into the rule dialog.
Find anything with the command palette
Press Ctrl+K (or Cmd+K on a Mac) on any BotBlocker page, or click the search field in the header. Type the name of a setting, a page, or an action. The palette searches the full settings index, so it also finds options inside tabs you have not opened. Choose a result to jump straight to that setting, or run a quick action such as Block an IP address, Set up 2FA, or Run malware scan. Use the arrow keys to move and Enter to open. Add-on and PRO entries appear in the same list.
Your plan at a glance
The PRO Status card shows your plan. With an active license, it also shows the days remaining and requests remaining, and which PRO options are On or Off. Click Manage plan to manage your license, or Upgrade to PRO to get the PRO features. See Plans and licensing.
Settings
Pause protection
Default: Enabled
The switch in the top banner turns BotBlocker on (Enabled) or off (Disabled). If you cannot reach the Dashboard, use the links in Emergency recovery secrets.
- Enabled: BotBlocker checks every request, as your settings say.
- Disabled: BotBlocker checks nothing, and the banner shows Protection paused. Bad bots get in too.
Use it as an emergency tool. For example, pause protection when a new setting locks out your customers, and you need a minute to find the cause. Then fix the setting and turn protection on again as soon as possible. When you apply a protection level (in the wizard or with One-click setup), protection also turns on again.
If you deactivate BotBlocker
When you click Deactivate on the WordPress Plugins screen, BotBlocker asks one last question before it lets go. The window Before you go offers a reason: temporary, too complex, performance, blocked legitimate traffic, a better alternative, a missing feature, a technical problem, or other. You can add details, then click Send and deactivate or Skip and deactivate.
If you are troubleshooting, do not deactivate at all. Click Pause protection instead. BotBlocker pauses the protection, shows Protection Paused, and leaves the plugin and all your settings in place, so traffic passes freely while you test a theme, a plugin or a host change. Turn the switch on the Dashboard back on when you are done.
Deactivating keeps your settings, rules and logs in the database. Deleting the plugin from WordPress removes them. Read Privacy and data before you delete.
When something looks wrong
- Numbers stay at zero? Look at the banner. If it shows Protection paused, turn protection on. If protection is on, wait for new visits and refresh the page.
- Numbers or the score look old? BotBlocker can keep a short-term copy of Dashboard data to load it faster (the Cache Plugin Interface setting). Wait a few minutes, and then refresh.
- The score is lower than you expect? Look at the Protection status checklist for crosses. On a free plan, about 75% is the normal maximum.
- A card shows a lock or a PRO badge? That part needs a plan. See Plans and licensing.
- One visitor was treated wrongly? Do not change settings yet. First, find the visit in the log. See Log and reports.
- Locked out of your site? Use your secret links. See Emergency recovery secrets.